> ## Documentation Index
> Fetch the complete documentation index at: https://docs.slng.ai/llms.txt
> Use this file to discover all available pages before exploring further.
# Debug a call
> Inspect an agent's calls and find where a session went wrong.
Every call an agent handles is recorded under **Observe → Calls** in your
project. Open a call to replay the transcript, see which tools ran, read the
operational events, and inspect the metadata. Use it to find where a session
went wrong.
Calls are scoped to the project and its agent. For account-level model API
requests and spend totals, see [Usage and billing](/guides/usage-and-billing).
## Open the calls list
In your project, go to **Observe → Calls**. The list shows recent calls with
times in your local timezone.
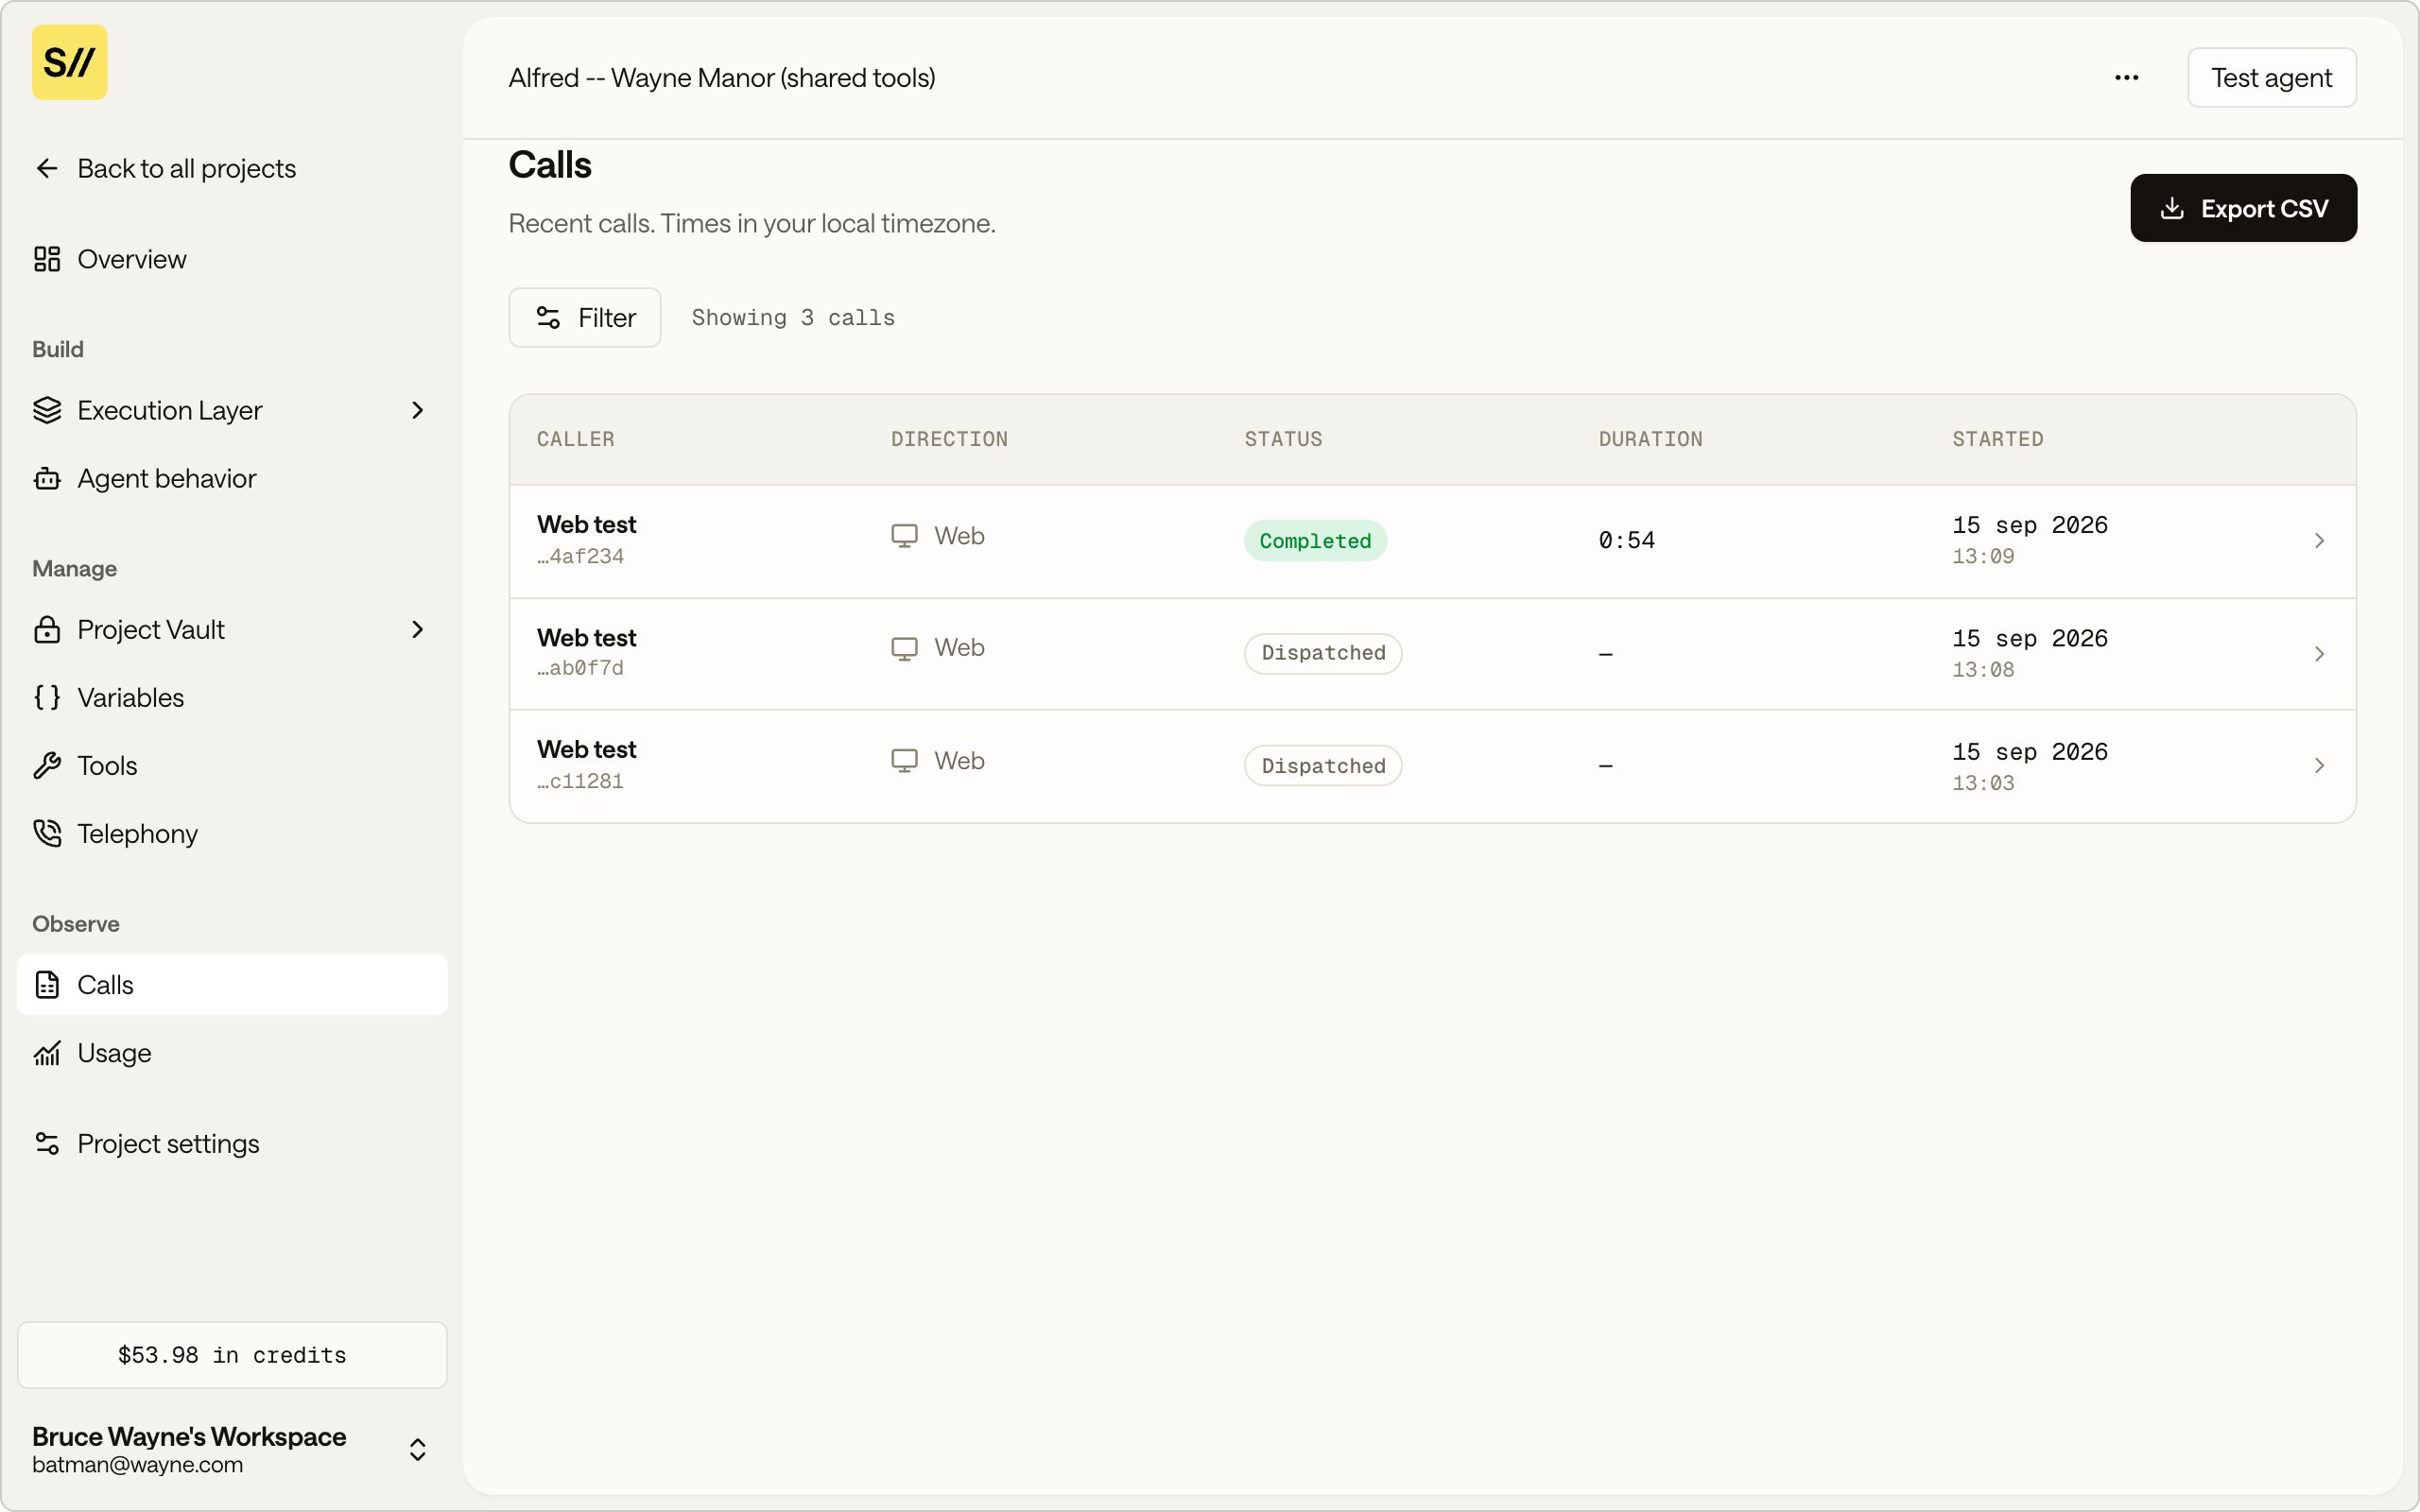 Each row summarizes one call:
| Column | What it tells you |
| ------------- | -------------------------------------------------- |
| **Caller** | The caller label and a short call ID |
| **Direction** | Where the call came from, such as **Web** or phone |
| **Status** | The outcome, such as **Completed** |
| **Duration** | How long the call ran |
| **Started** | When the call began |
Use **Filter** to narrow the list, and **Export CSV** to pull the calls out for
your own reporting. Click a row to open the call.
## Read a call
The call header shows the call name and its full ID with a copy button, then
four summary cards: **Direction**, **Duration**, **Started**, and **Status**.
Four tabs hold the detail.
### Transcript
The turn-by-turn conversation between the caller and the agent. Read it to see
what the agent said and where it misunderstood the caller.
### Tools
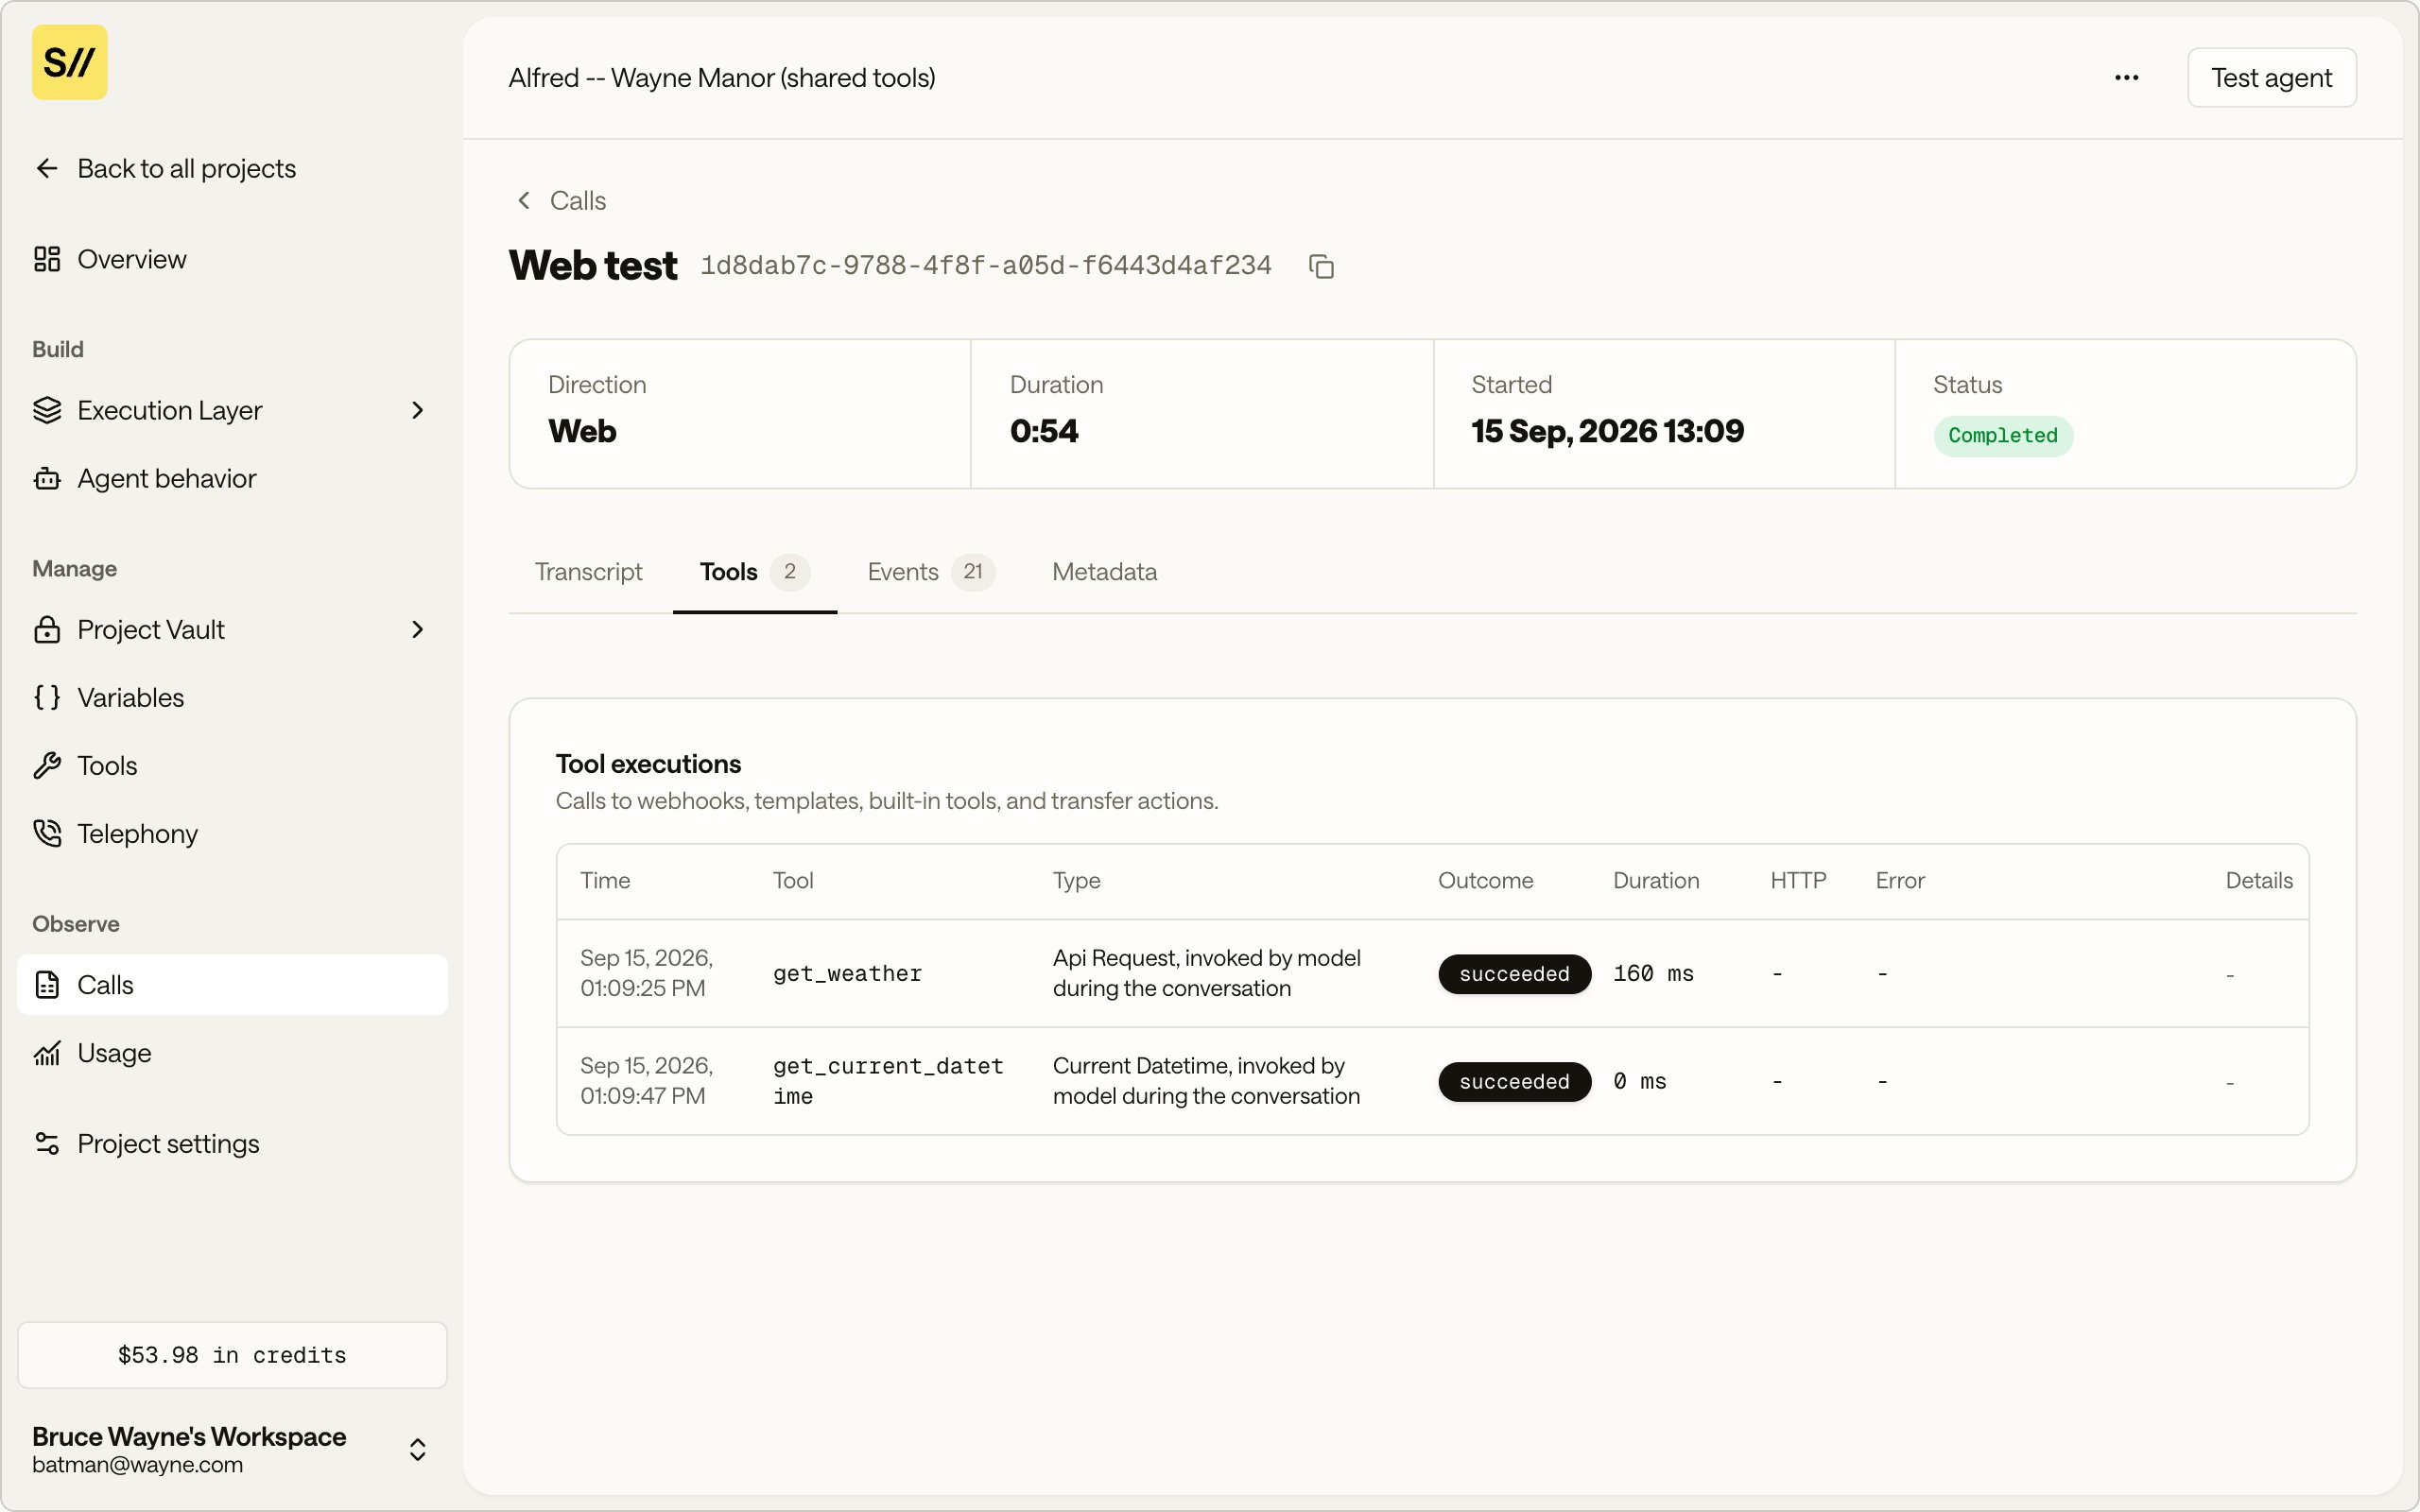
The tools the agent called during the session and what each returned: webhooks,
templates, built-in tools, and transfer actions. Each row shows the time, tool
name, type, **Outcome** (**succeeded** or **failed**), duration, **HTTP** status,
and any **Error**. Expand **View** for the detail.
Check here when the agent should have taken an action but did not, or a tool
returned the wrong result. Read each tool's **Outcome** and **HTTP** status. A
green **Status** on the call still leaves room for a `failed` tool, so a failed
row here is often the first sign of what went wrong.
Each row summarizes one call:
| Column | What it tells you |
| ------------- | -------------------------------------------------- |
| **Caller** | The caller label and a short call ID |
| **Direction** | Where the call came from, such as **Web** or phone |
| **Status** | The outcome, such as **Completed** |
| **Duration** | How long the call ran |
| **Started** | When the call began |
Use **Filter** to narrow the list, and **Export CSV** to pull the calls out for
your own reporting. Click a row to open the call.
## Read a call
The call header shows the call name and its full ID with a copy button, then
four summary cards: **Direction**, **Duration**, **Started**, and **Status**.
Four tabs hold the detail.
### Transcript
The turn-by-turn conversation between the caller and the agent. Read it to see
what the agent said and where it misunderstood the caller.
### Tools
The tools the agent called during the session and what each returned: webhooks,
templates, built-in tools, and transfer actions. Each row shows the time, tool
name, type, **Outcome** (**succeeded** or **failed**), duration, **HTTP** status,
and any **Error**. Expand **View** for the detail.
Check here when the agent should have taken an action but did not, or a tool
returned the wrong result. Read each tool's **Outcome** and **HTTP** status. A
green **Status** on the call still leaves room for a `failed` tool, so a failed
row here is often the first sign of what went wrong.
 ### Events
Operational events recorded during the call lifecycle. Each row carries a
timestamp, the event name, a severity badge (such as **info**), and optional
**Component**, **Model**, **Reason**, and **Error** columns. Expand **JSON** on a
row for its full payload.
### Events
Operational events recorded during the call lifecycle. Each row carries a
timestamp, the event name, a severity badge (such as **info**), and optional
**Component**, **Model**, **Reason**, and **Error** columns. Expand **JSON** on a
row for its full payload.
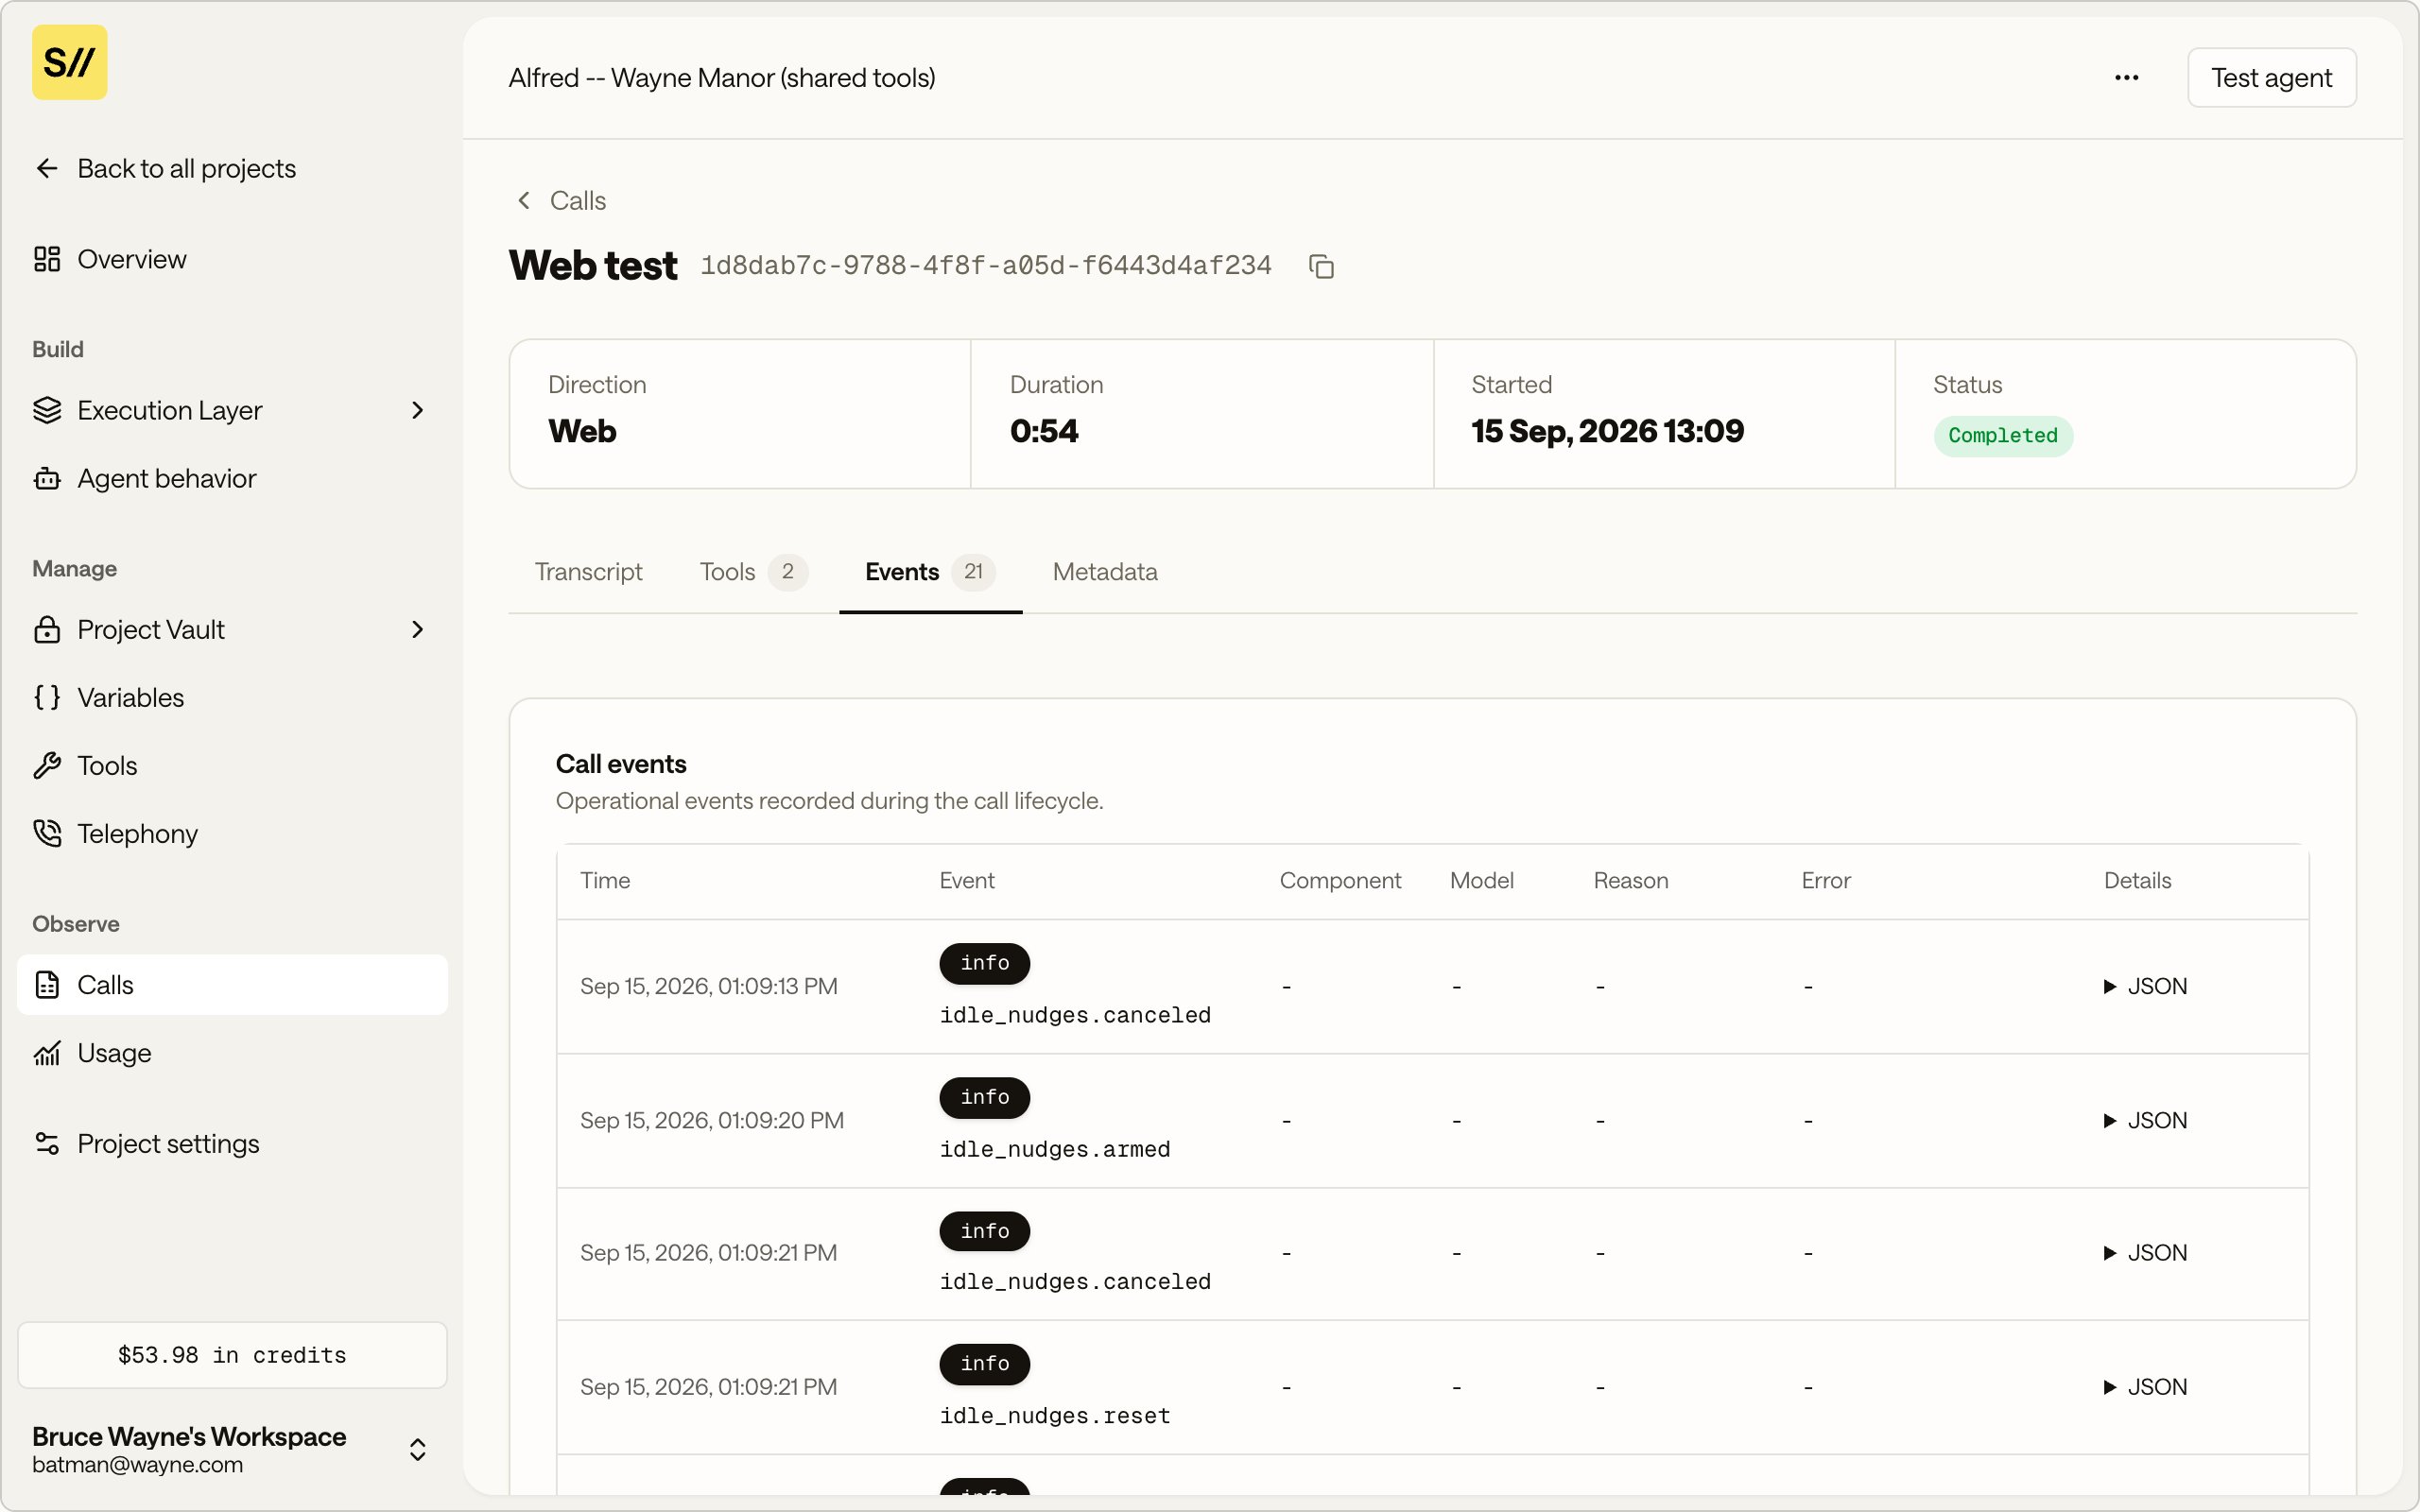 This is the first place to look when a call failed. Scan the **Error** and
**Reason** columns for the event that broke, then expand its **JSON** for the
detail.
### Metadata
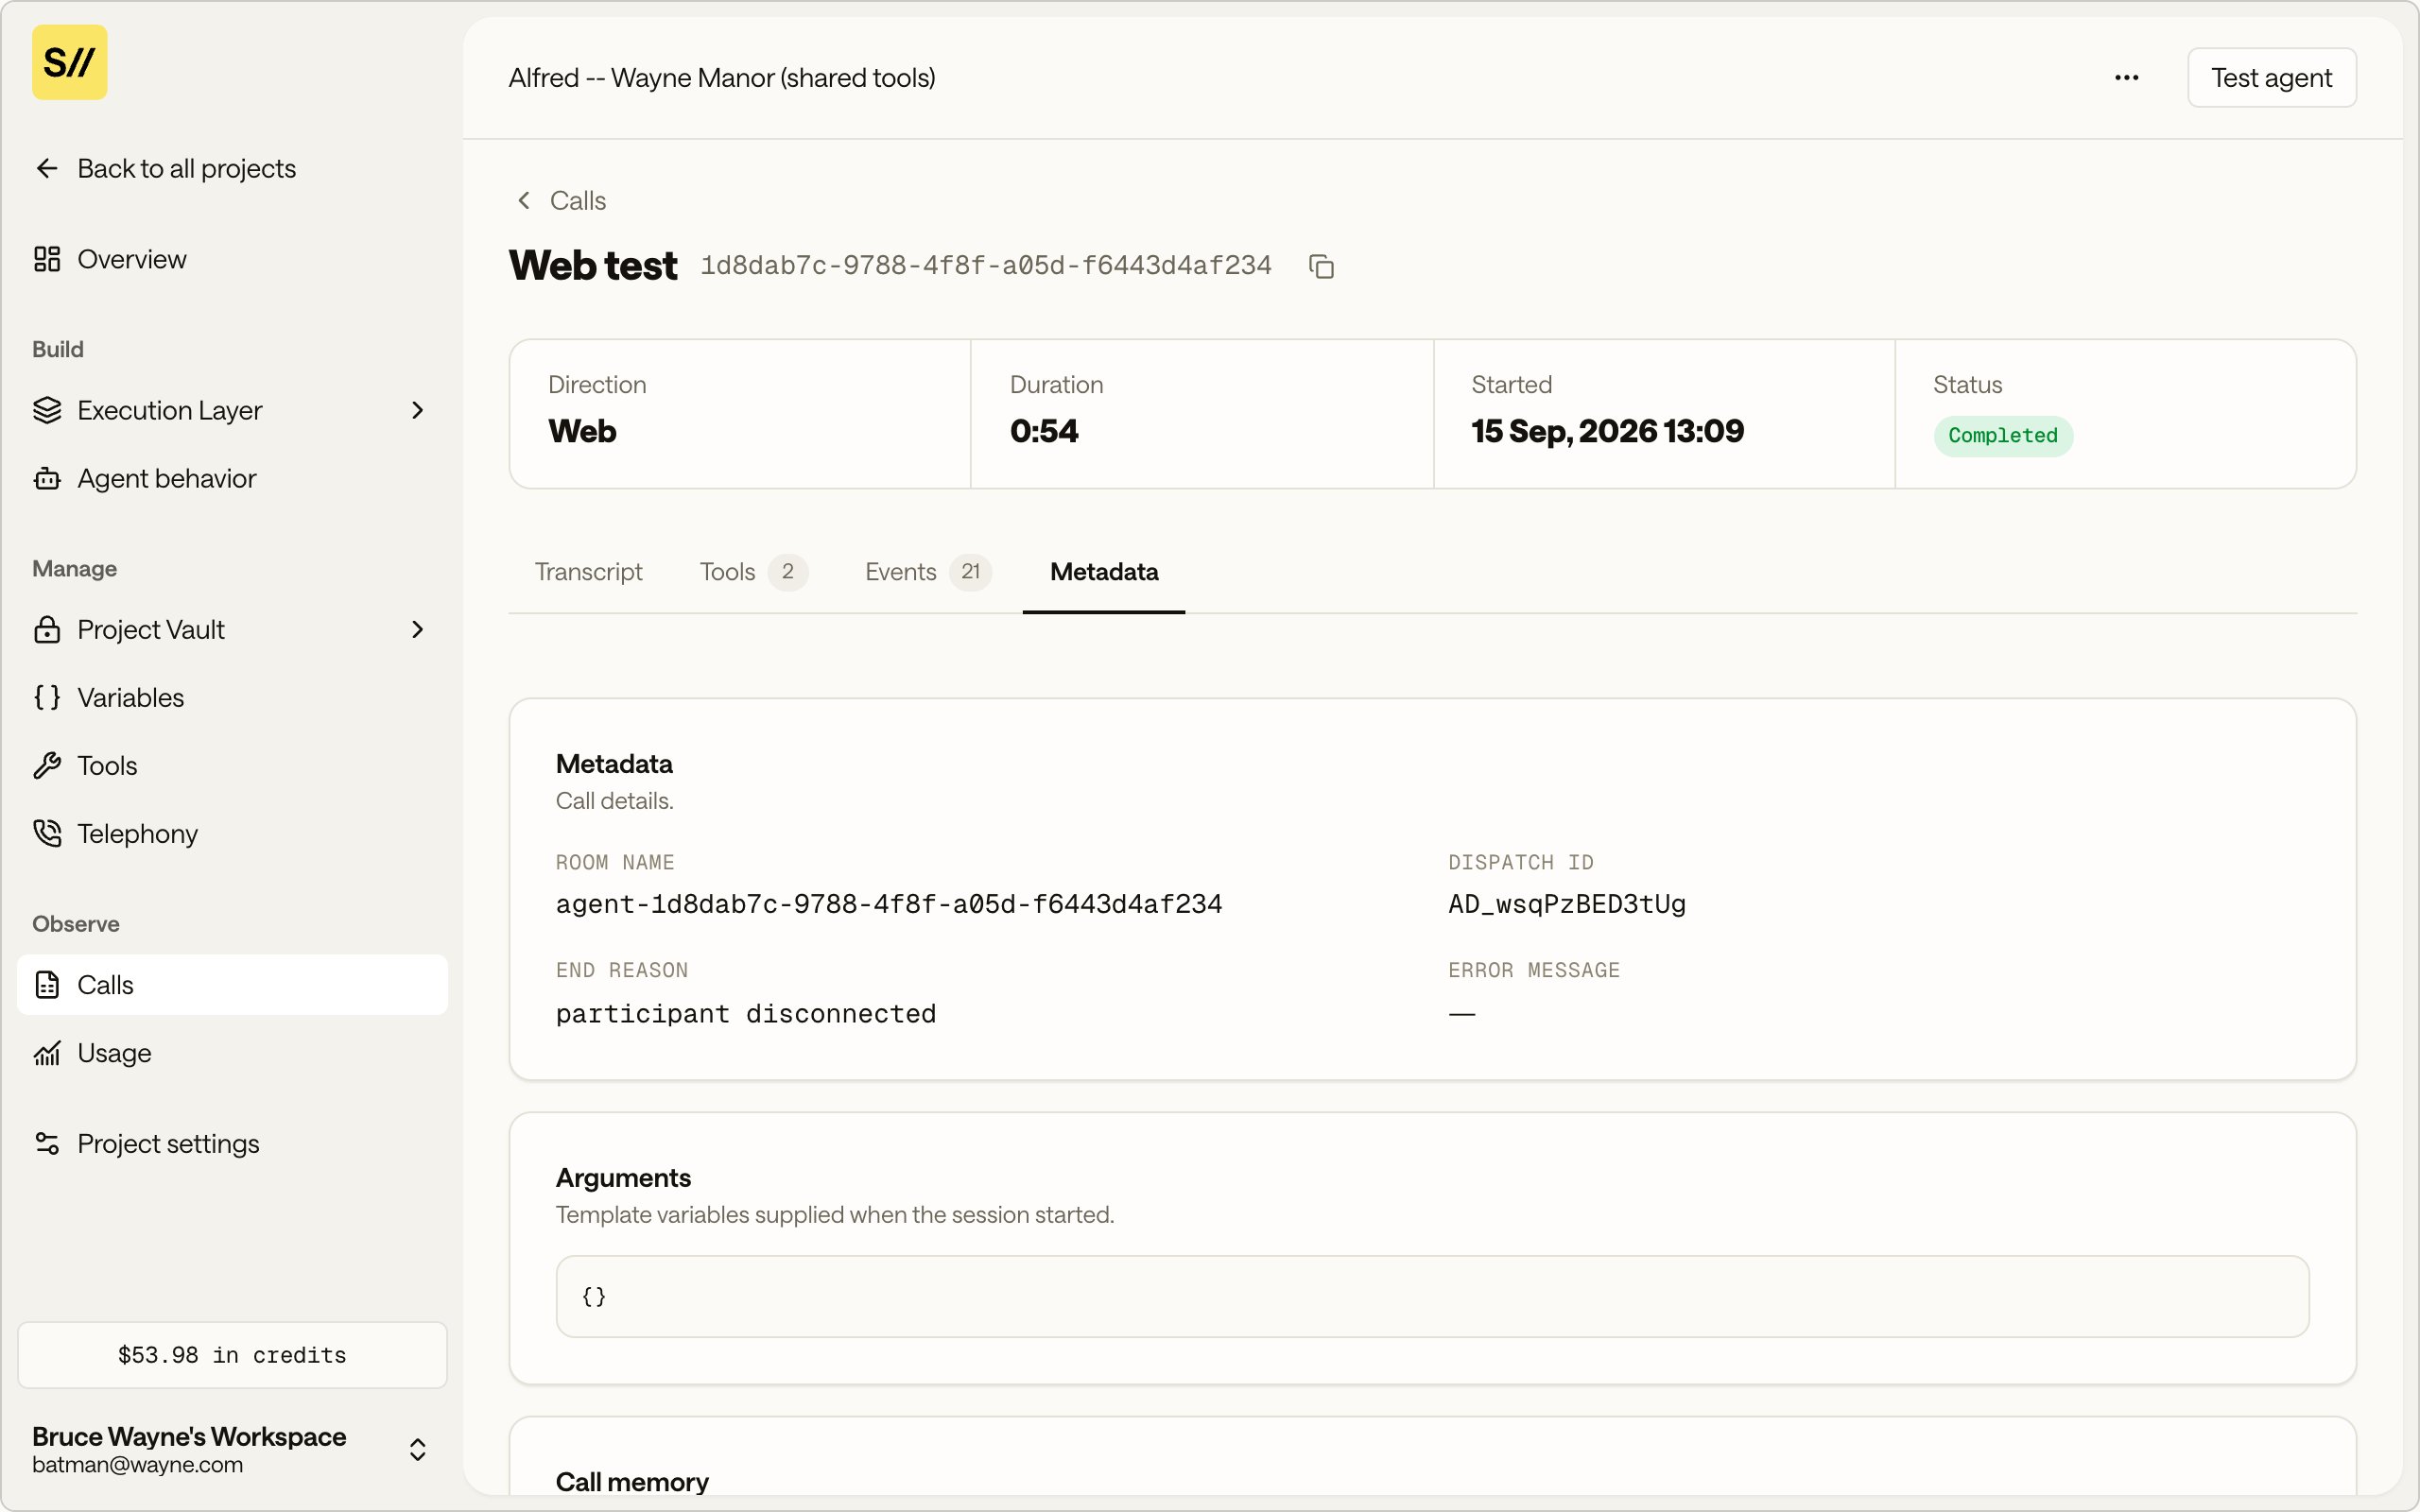
Call details and the inputs that shaped the session:
* **Room name** and **Dispatch ID** identify the session.
* **End reason** says why the call ended, such as `participant disconnected`.
* **Error message** carries the failure text when a call ended on an error.
* **Arguments** shows the template variables supplied when the session started.
* **Call memory** shows values captured or updated during the call.
* **Rendered prompt** shows the final prompt used for this call, after variables
resolved.
* **Advanced** holds the raw lifecycle report data to share with support.
This is the first place to look when a call failed. Scan the **Error** and
**Reason** columns for the event that broke, then expand its **JSON** for the
detail.
### Metadata
Call details and the inputs that shaped the session:
* **Room name** and **Dispatch ID** identify the session.
* **End reason** says why the call ended, such as `participant disconnected`.
* **Error message** carries the failure text when a call ended on an error.
* **Arguments** shows the template variables supplied when the session started.
* **Call memory** shows values captured or updated during the call.
* **Rendered prompt** shows the final prompt used for this call, after variables
resolved.
* **Advanced** holds the raw lifecycle report data to share with support.
 ## Find where a call went wrong
Work from the summary down to the raw data:
1. In the list, check the **Status**. Open the call that failed.
2. On **Metadata**, read **End reason** and **Error message** for the headline
cause.
3. On **Events**, find the event with an **Error** or **Reason** and expand its
**JSON**.
4. On **Transcript**, read the last exchange before the call dropped.
5. On **Tools**, check the **Outcome** and **HTTP** columns. A `failed` webhook
with `401` points at a missing or wrong credential on that tool, even when the
call completed.
6. Check the **Rendered prompt** to confirm variables resolved as intended.
7. For anything unresolved, open **Advanced** and share the raw report with
support.
Template variables that did not resolve are a common cause of odd behavior.
Compare **Arguments** against the **Rendered prompt** to confirm every variable
was supplied.
## Find where a call went wrong
Work from the summary down to the raw data:
1. In the list, check the **Status**. Open the call that failed.
2. On **Metadata**, read **End reason** and **Error message** for the headline
cause.
3. On **Events**, find the event with an **Error** or **Reason** and expand its
**JSON**.
4. On **Transcript**, read the last exchange before the call dropped.
5. On **Tools**, check the **Outcome** and **HTTP** columns. A `failed` webhook
with `401` points at a missing or wrong credential on that tool, even when the
call completed.
6. Check the **Rendered prompt** to confirm variables resolved as intended.
7. For anything unresolved, open **Advanced** and share the raw report with
support.
Template variables that did not resolve are a common cause of odd behavior.
Compare **Arguments** against the **Rendered prompt** to confirm every variable
was supplied.