
Open the calls list
In your project, go to Observe → Calls. The list shows recent calls with times in your local timezone.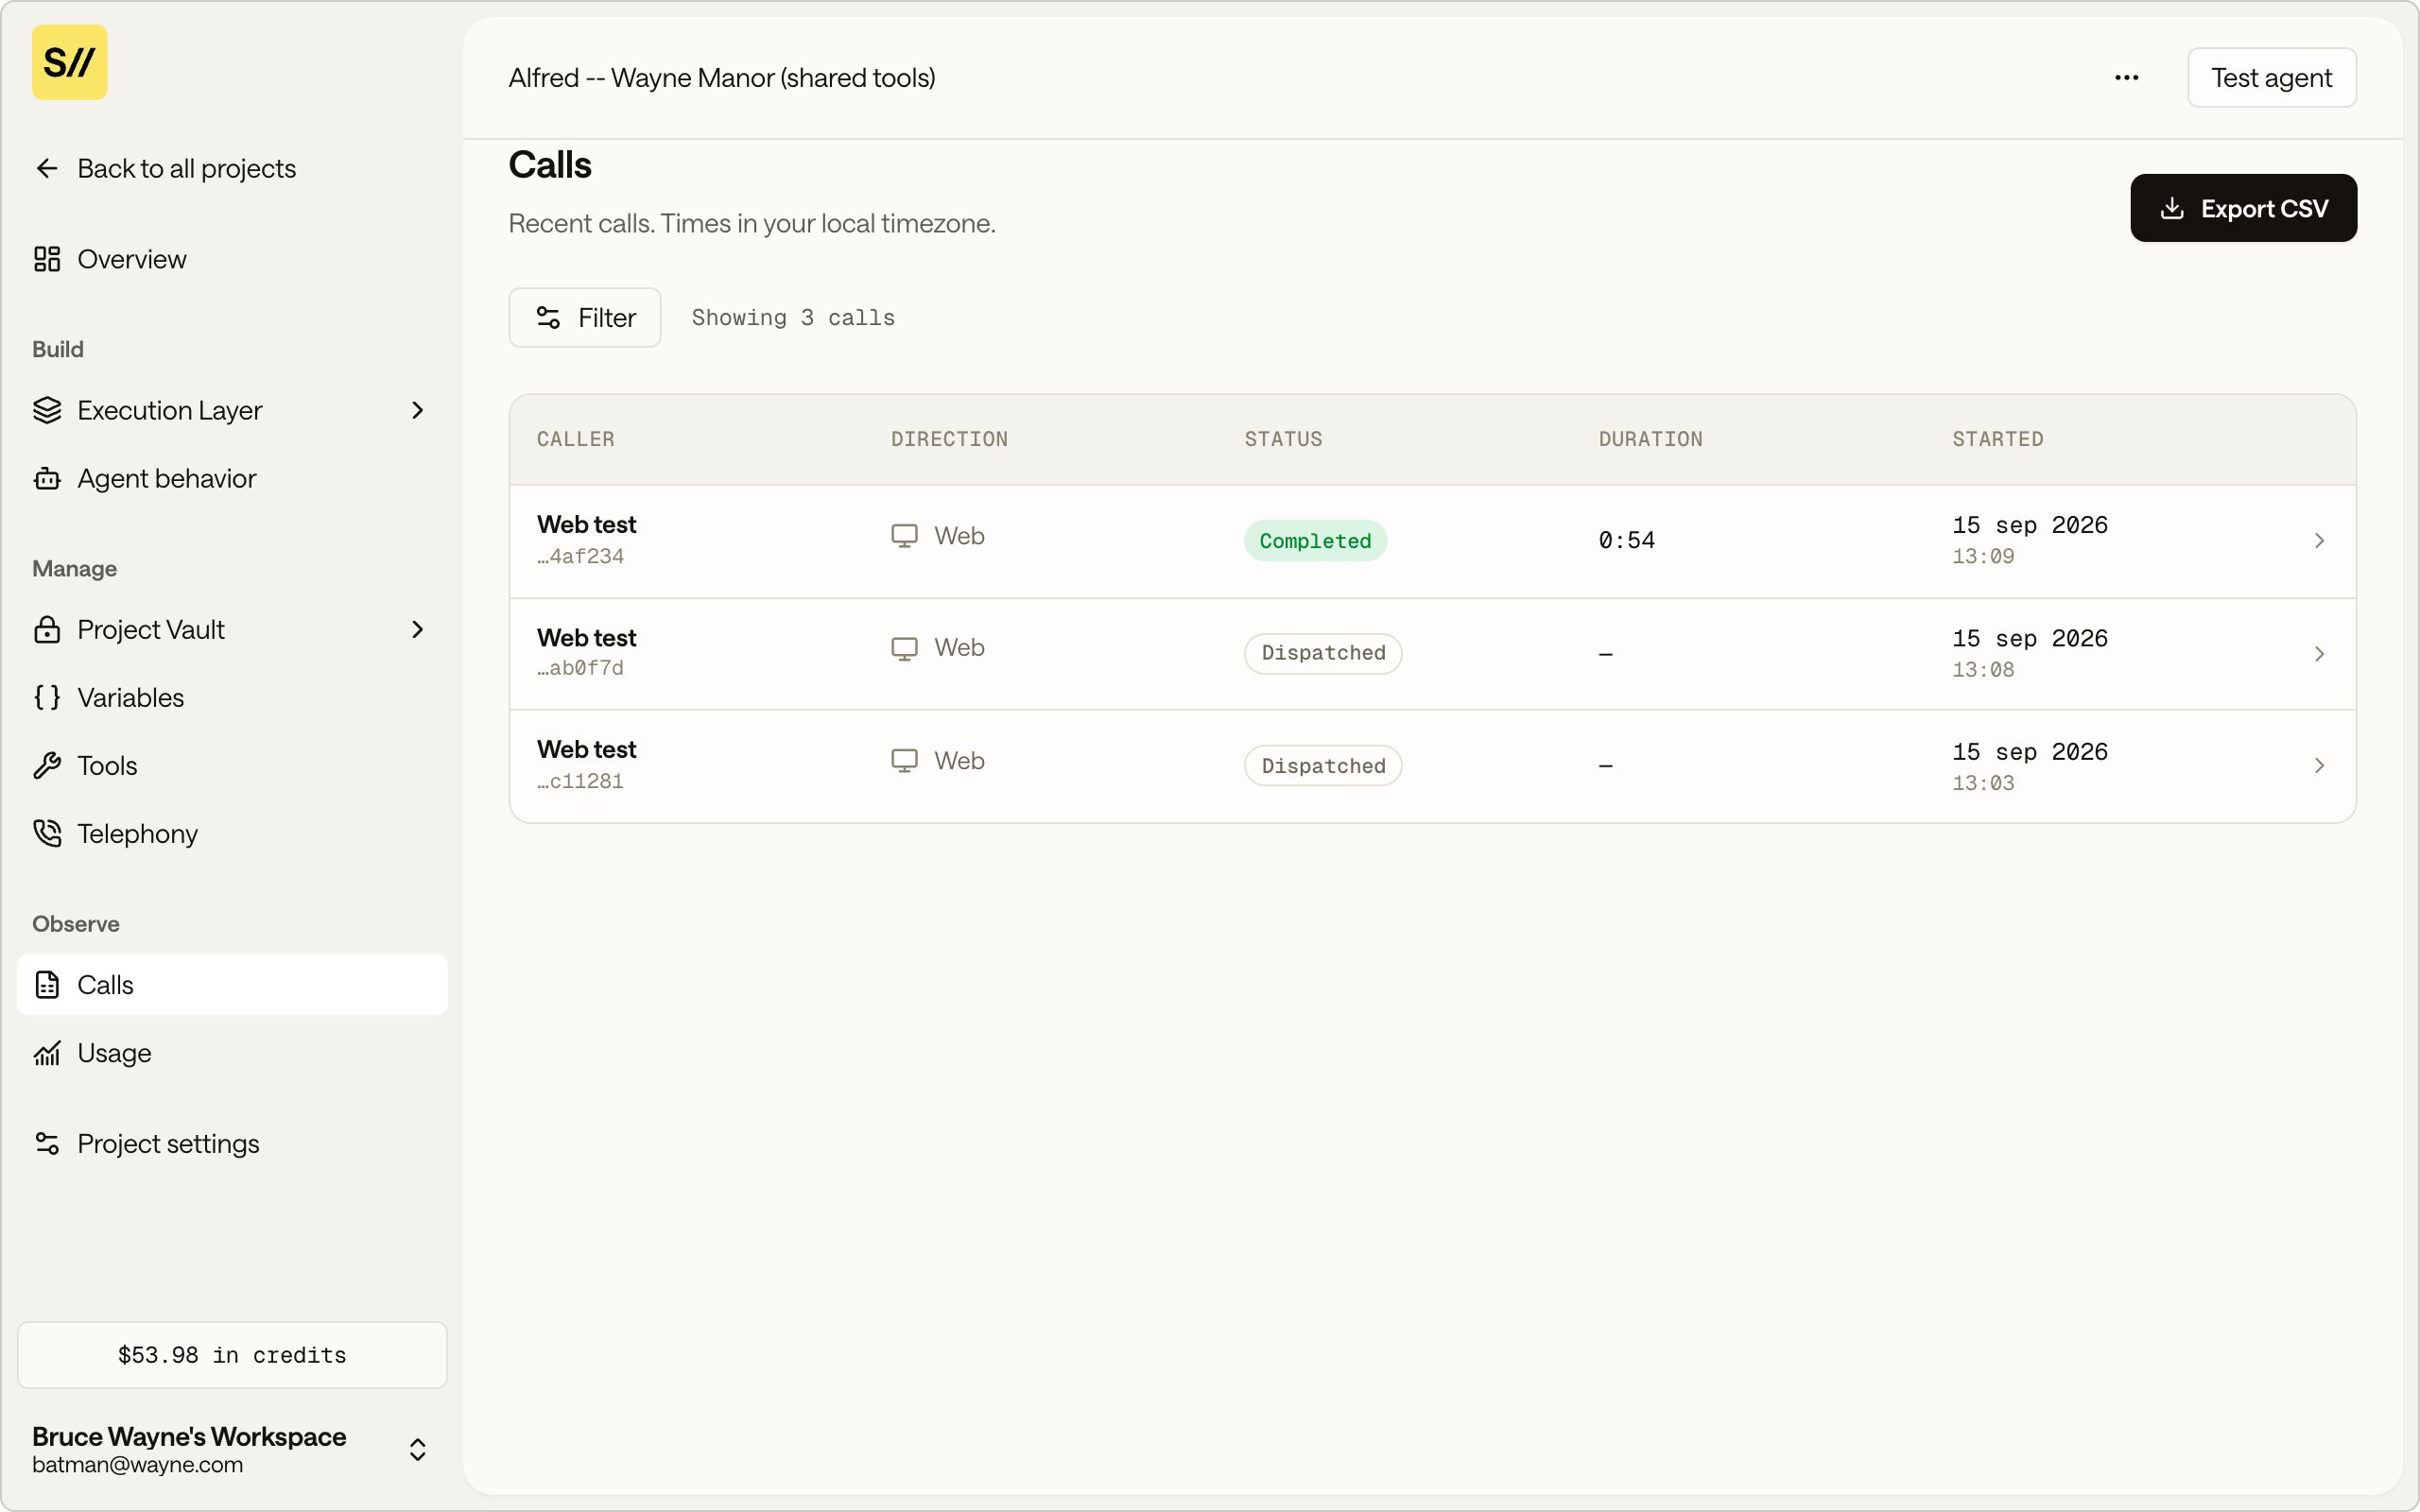
The Calls list under Observe, one row per call.
Use Filter to narrow the list, and Export CSV to pull the calls out for
your own reporting. Click a row to open the call.
Read a call
The call header shows the call name and its full ID with a copy button, then four summary cards: Direction, Duration, Started, and Status. Four tabs hold the detail.Transcript
The turn-by-turn conversation between the caller and the agent. Read it to see what the agent said and where it misunderstood the caller.Tools
The tools the agent called during the session and what each returned: webhooks, templates, built-in tools, and transfer actions. Each row shows the time, tool name, type, Outcome (succeeded or failed), duration, HTTP status, and any Error. Expand View for the detail. Check here when the agent should have taken an action but did not, or a tool returned the wrong result. Read each tool’s Outcome and HTTP status. A green Status on the call still leaves room for afailed tool, so a failed
row here is often the first sign of what went wrong.
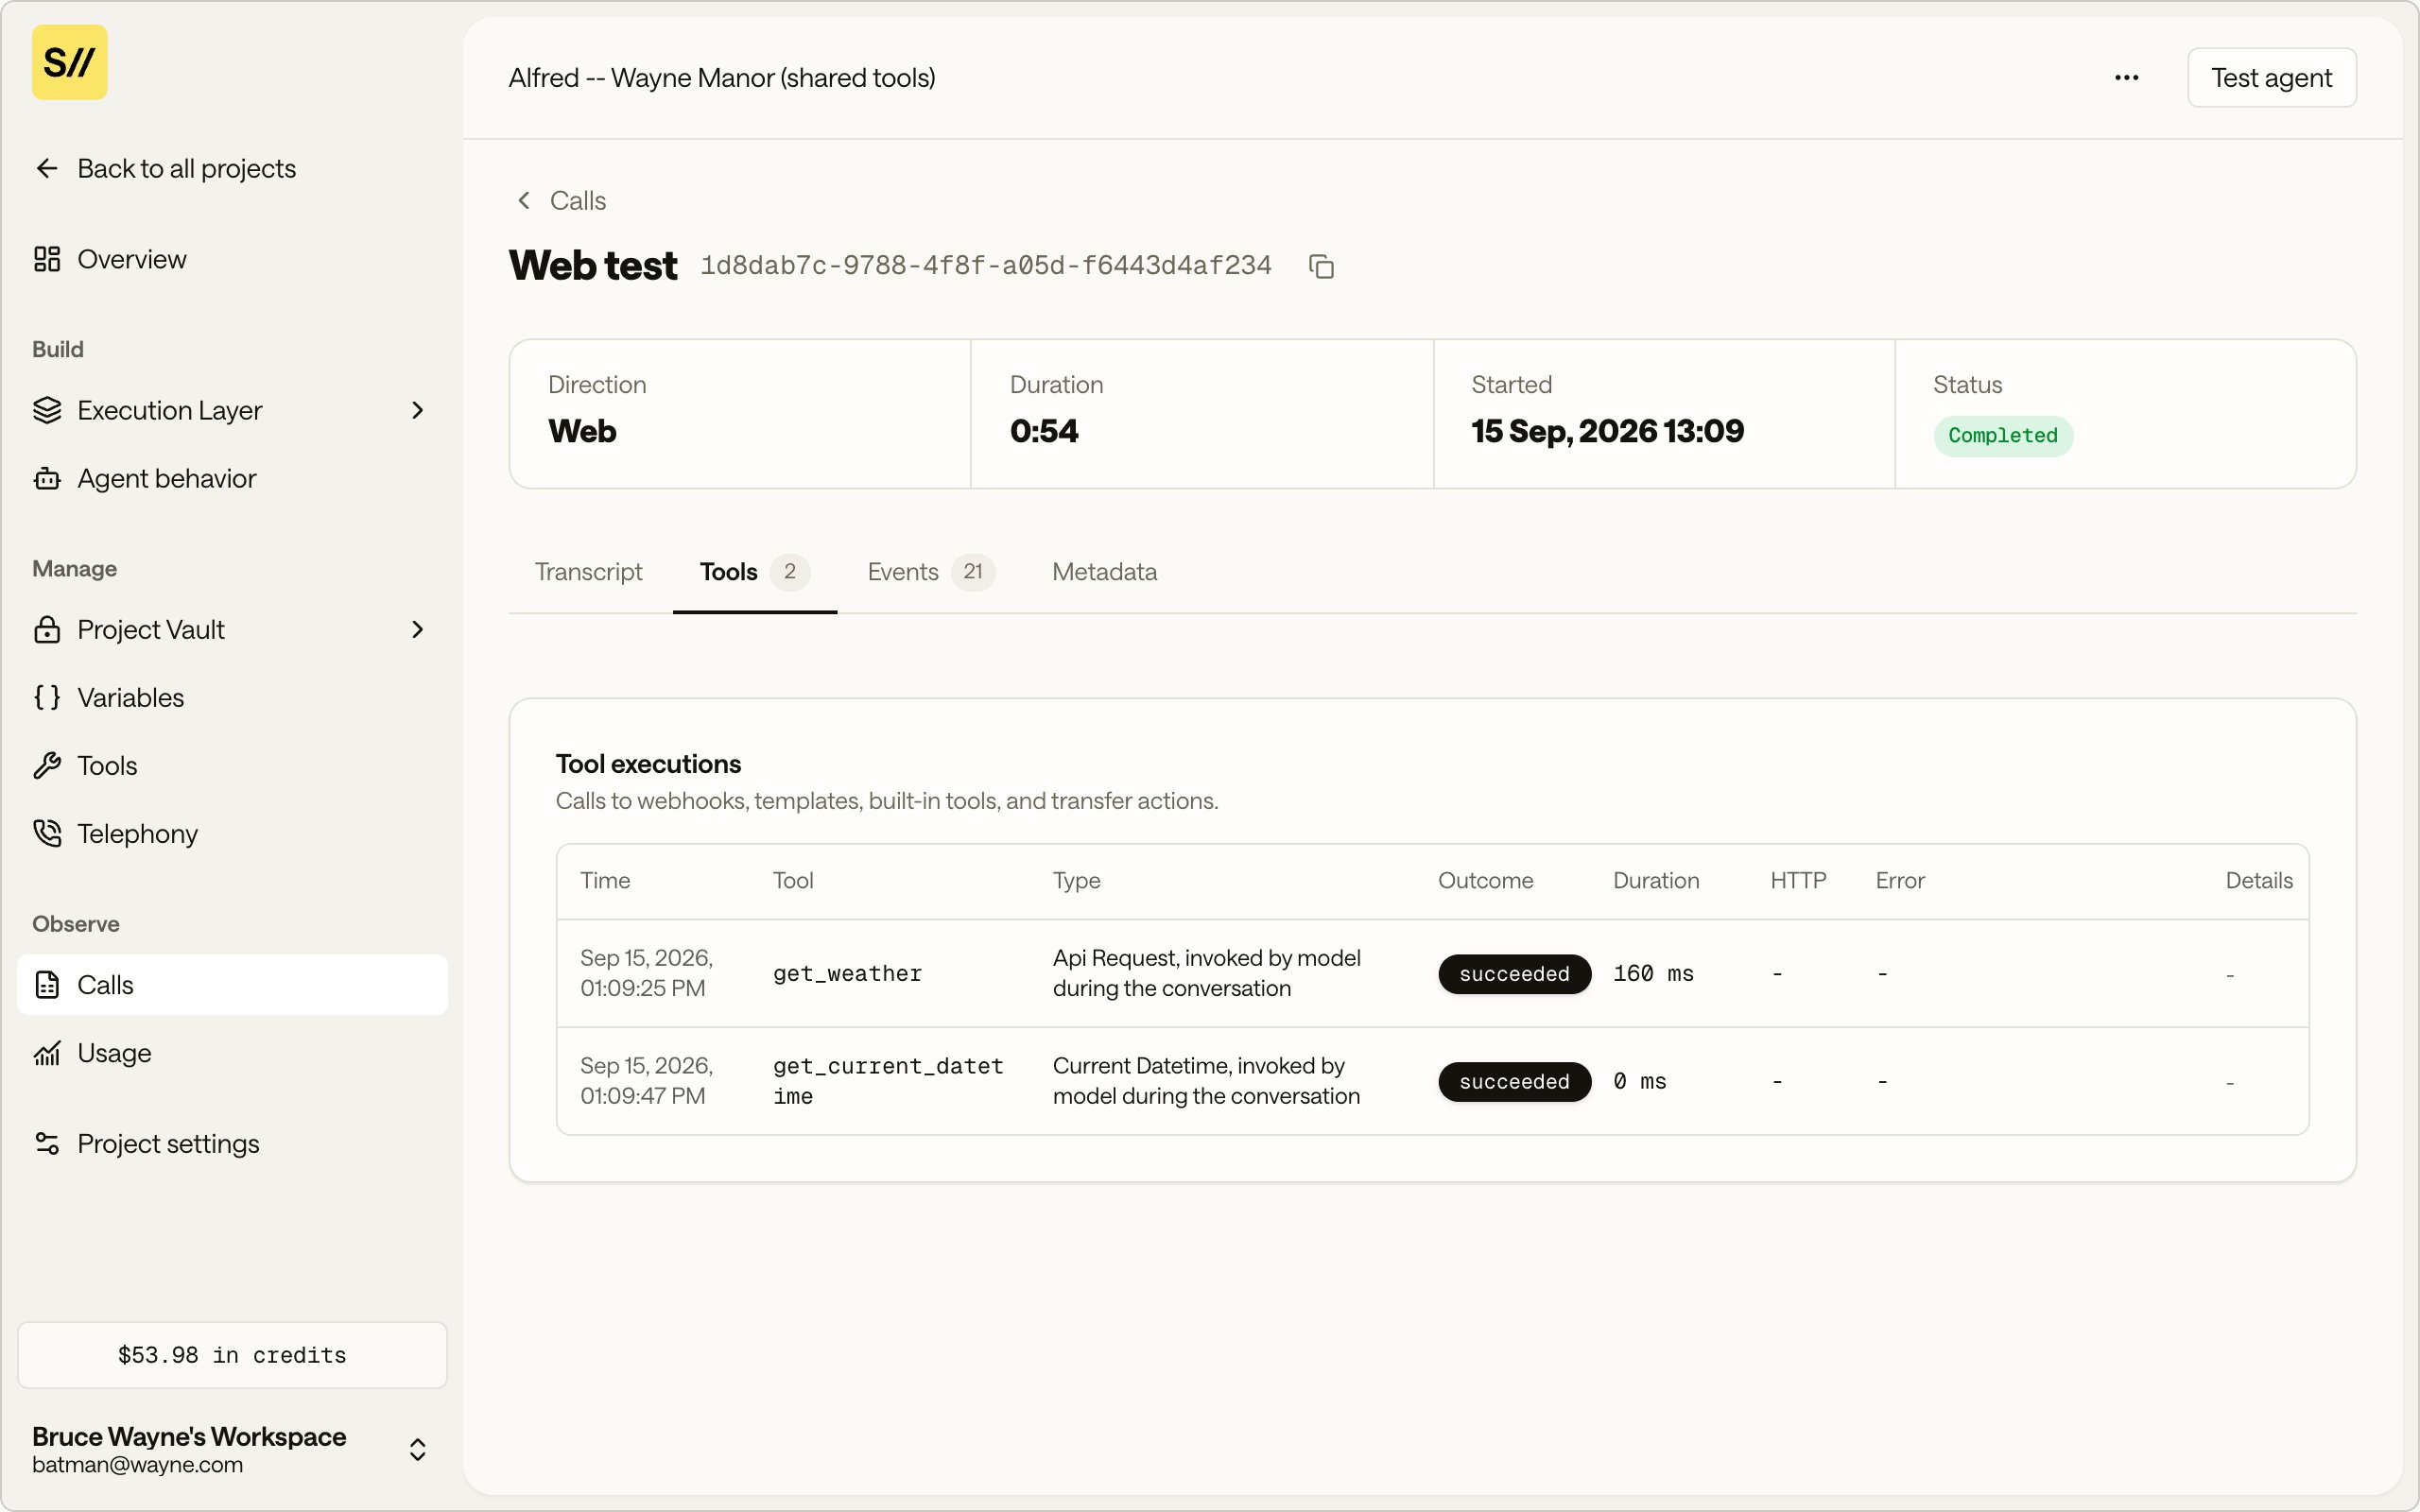
The Tools tab, showing the get_weather and current datetime tools that ran on the call, both succeeded.
Events
Operational events recorded during the call lifecycle. Each row carries a timestamp, the event name, a severity badge (such as info), and optional Component, Model, Reason, and Error columns. Expand JSON on a row for its full payload.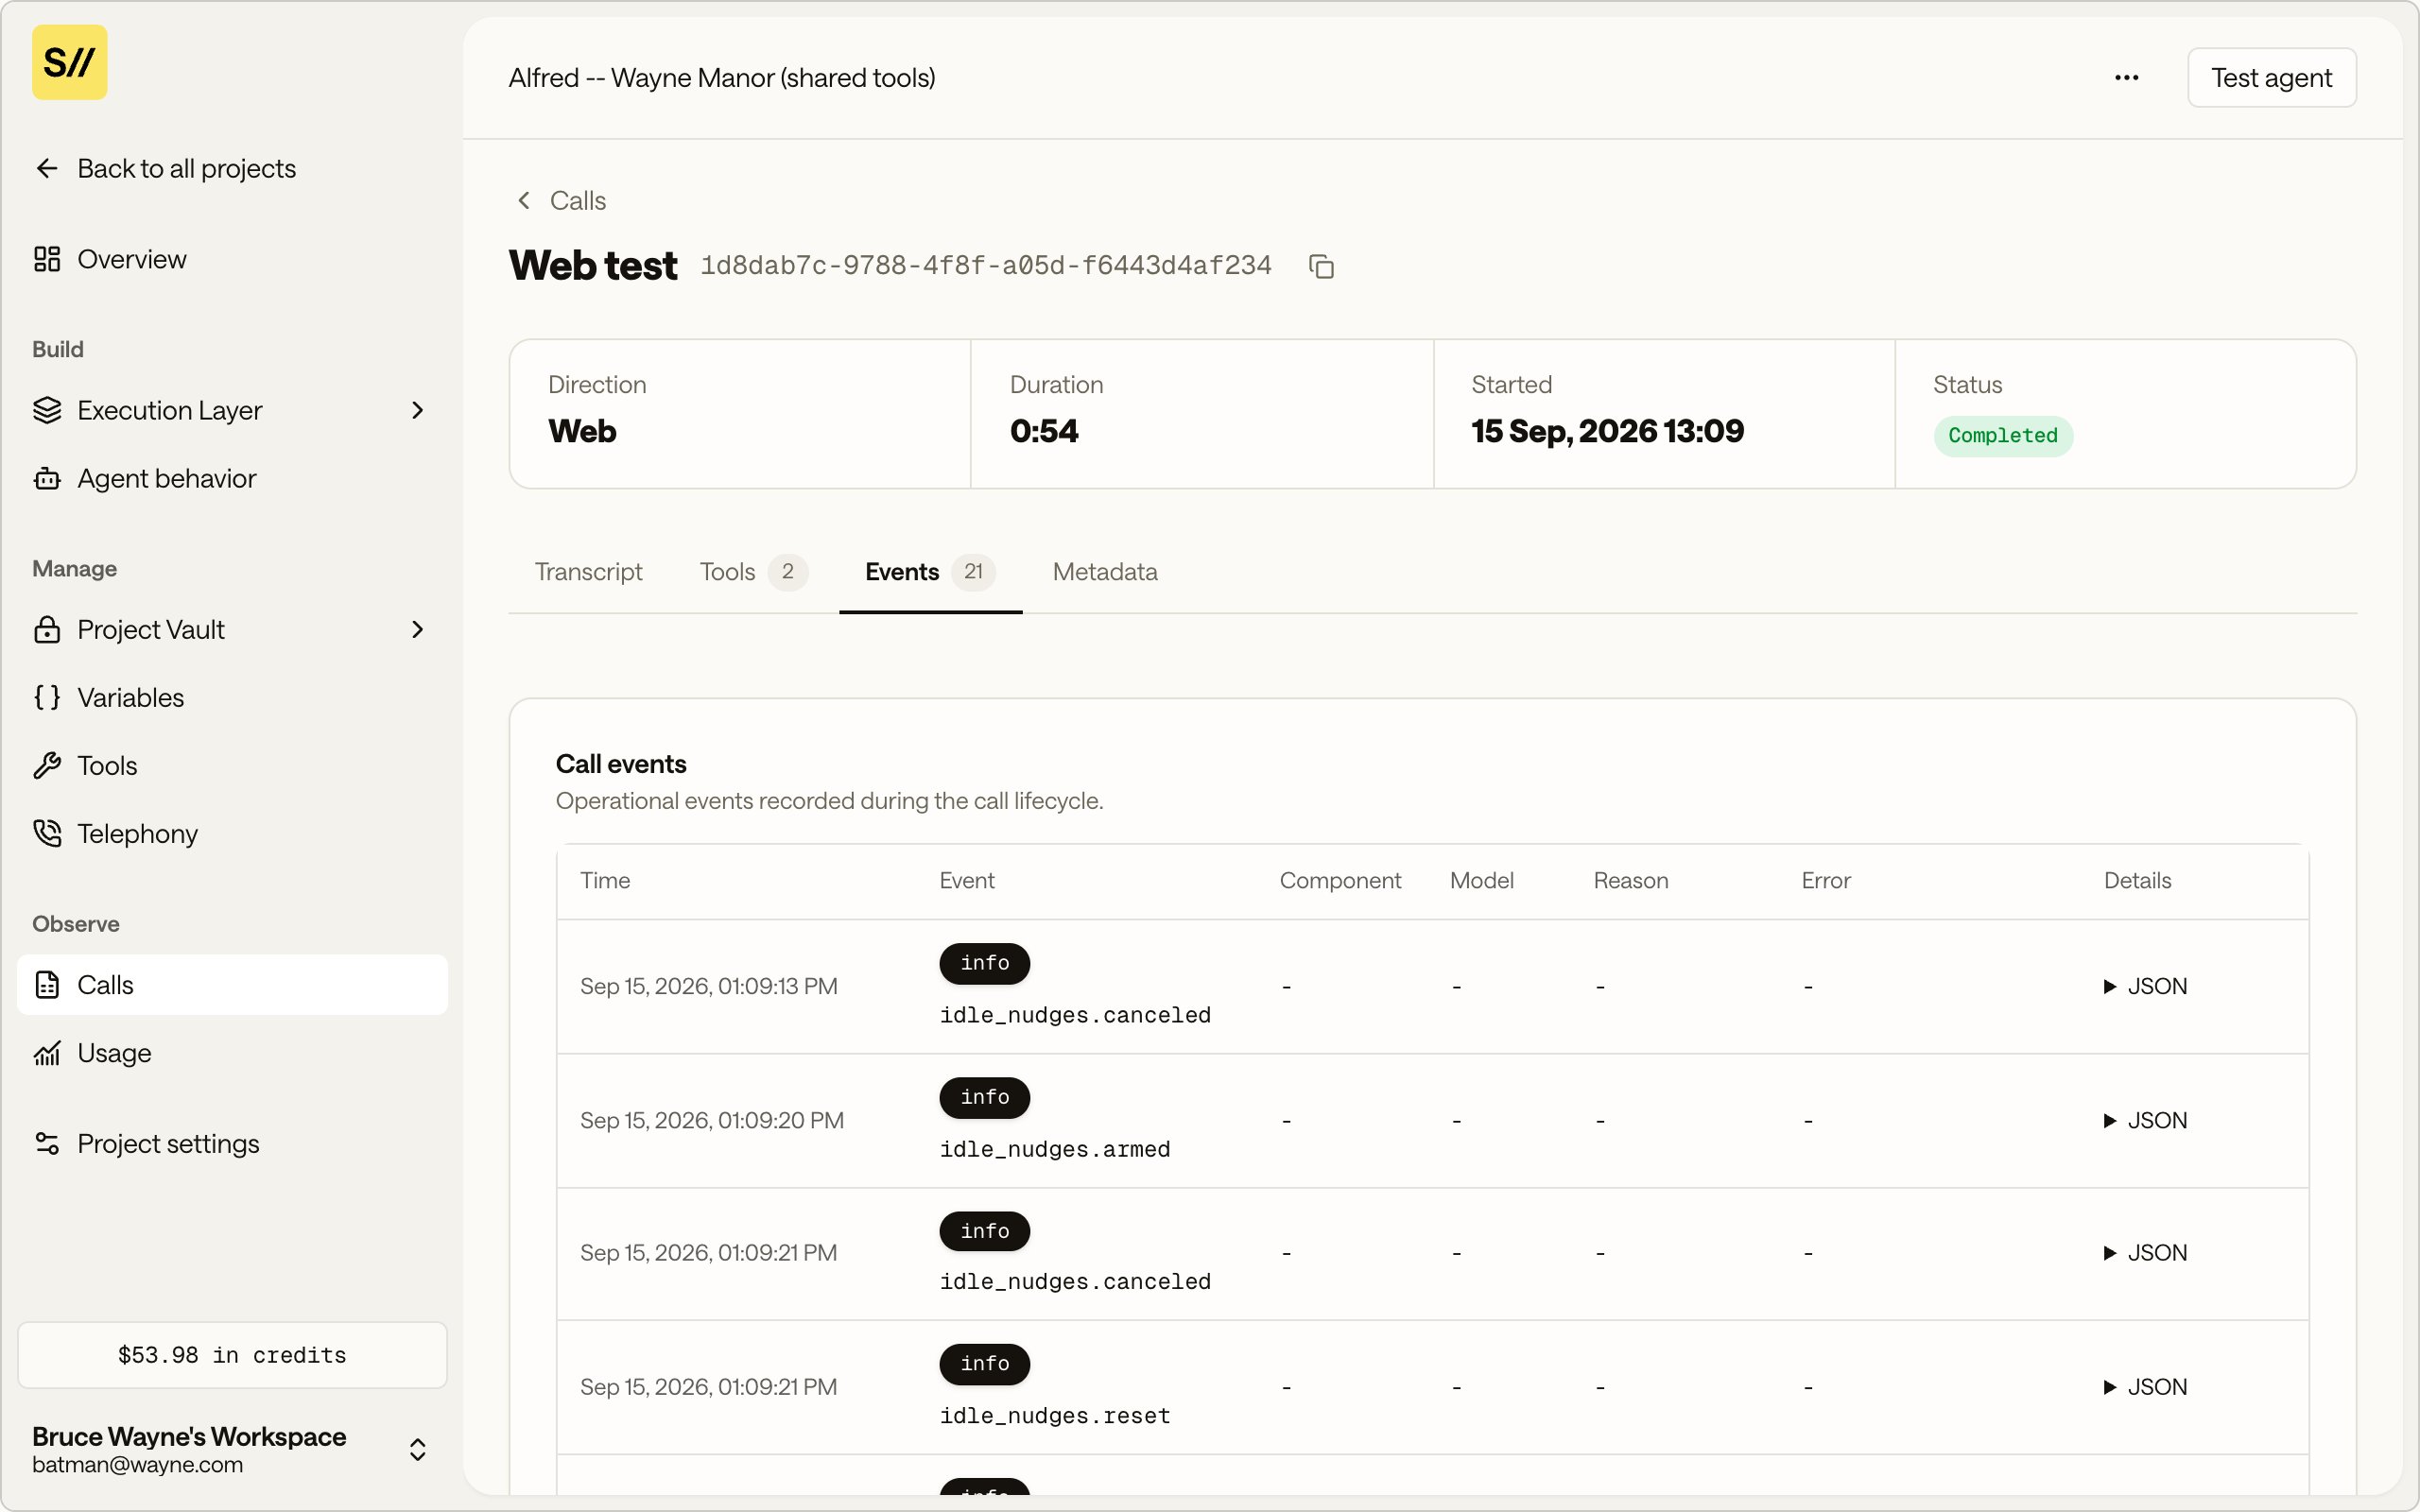
The Events tab, listing lifecycle events with an expandable JSON payload per row.
Metadata
Call details and the inputs that shaped the session:- Room name and Dispatch ID identify the session.
- End reason says why the call ended, such as
participant disconnected. - Error message carries the failure text when a call ended on an error.
- Arguments shows the template variables supplied when the session started.
- Call memory shows values captured or updated during the call.
- Rendered prompt shows the final prompt used for this call, after variables resolved.
- Advanced holds the raw lifecycle report data to share with support.
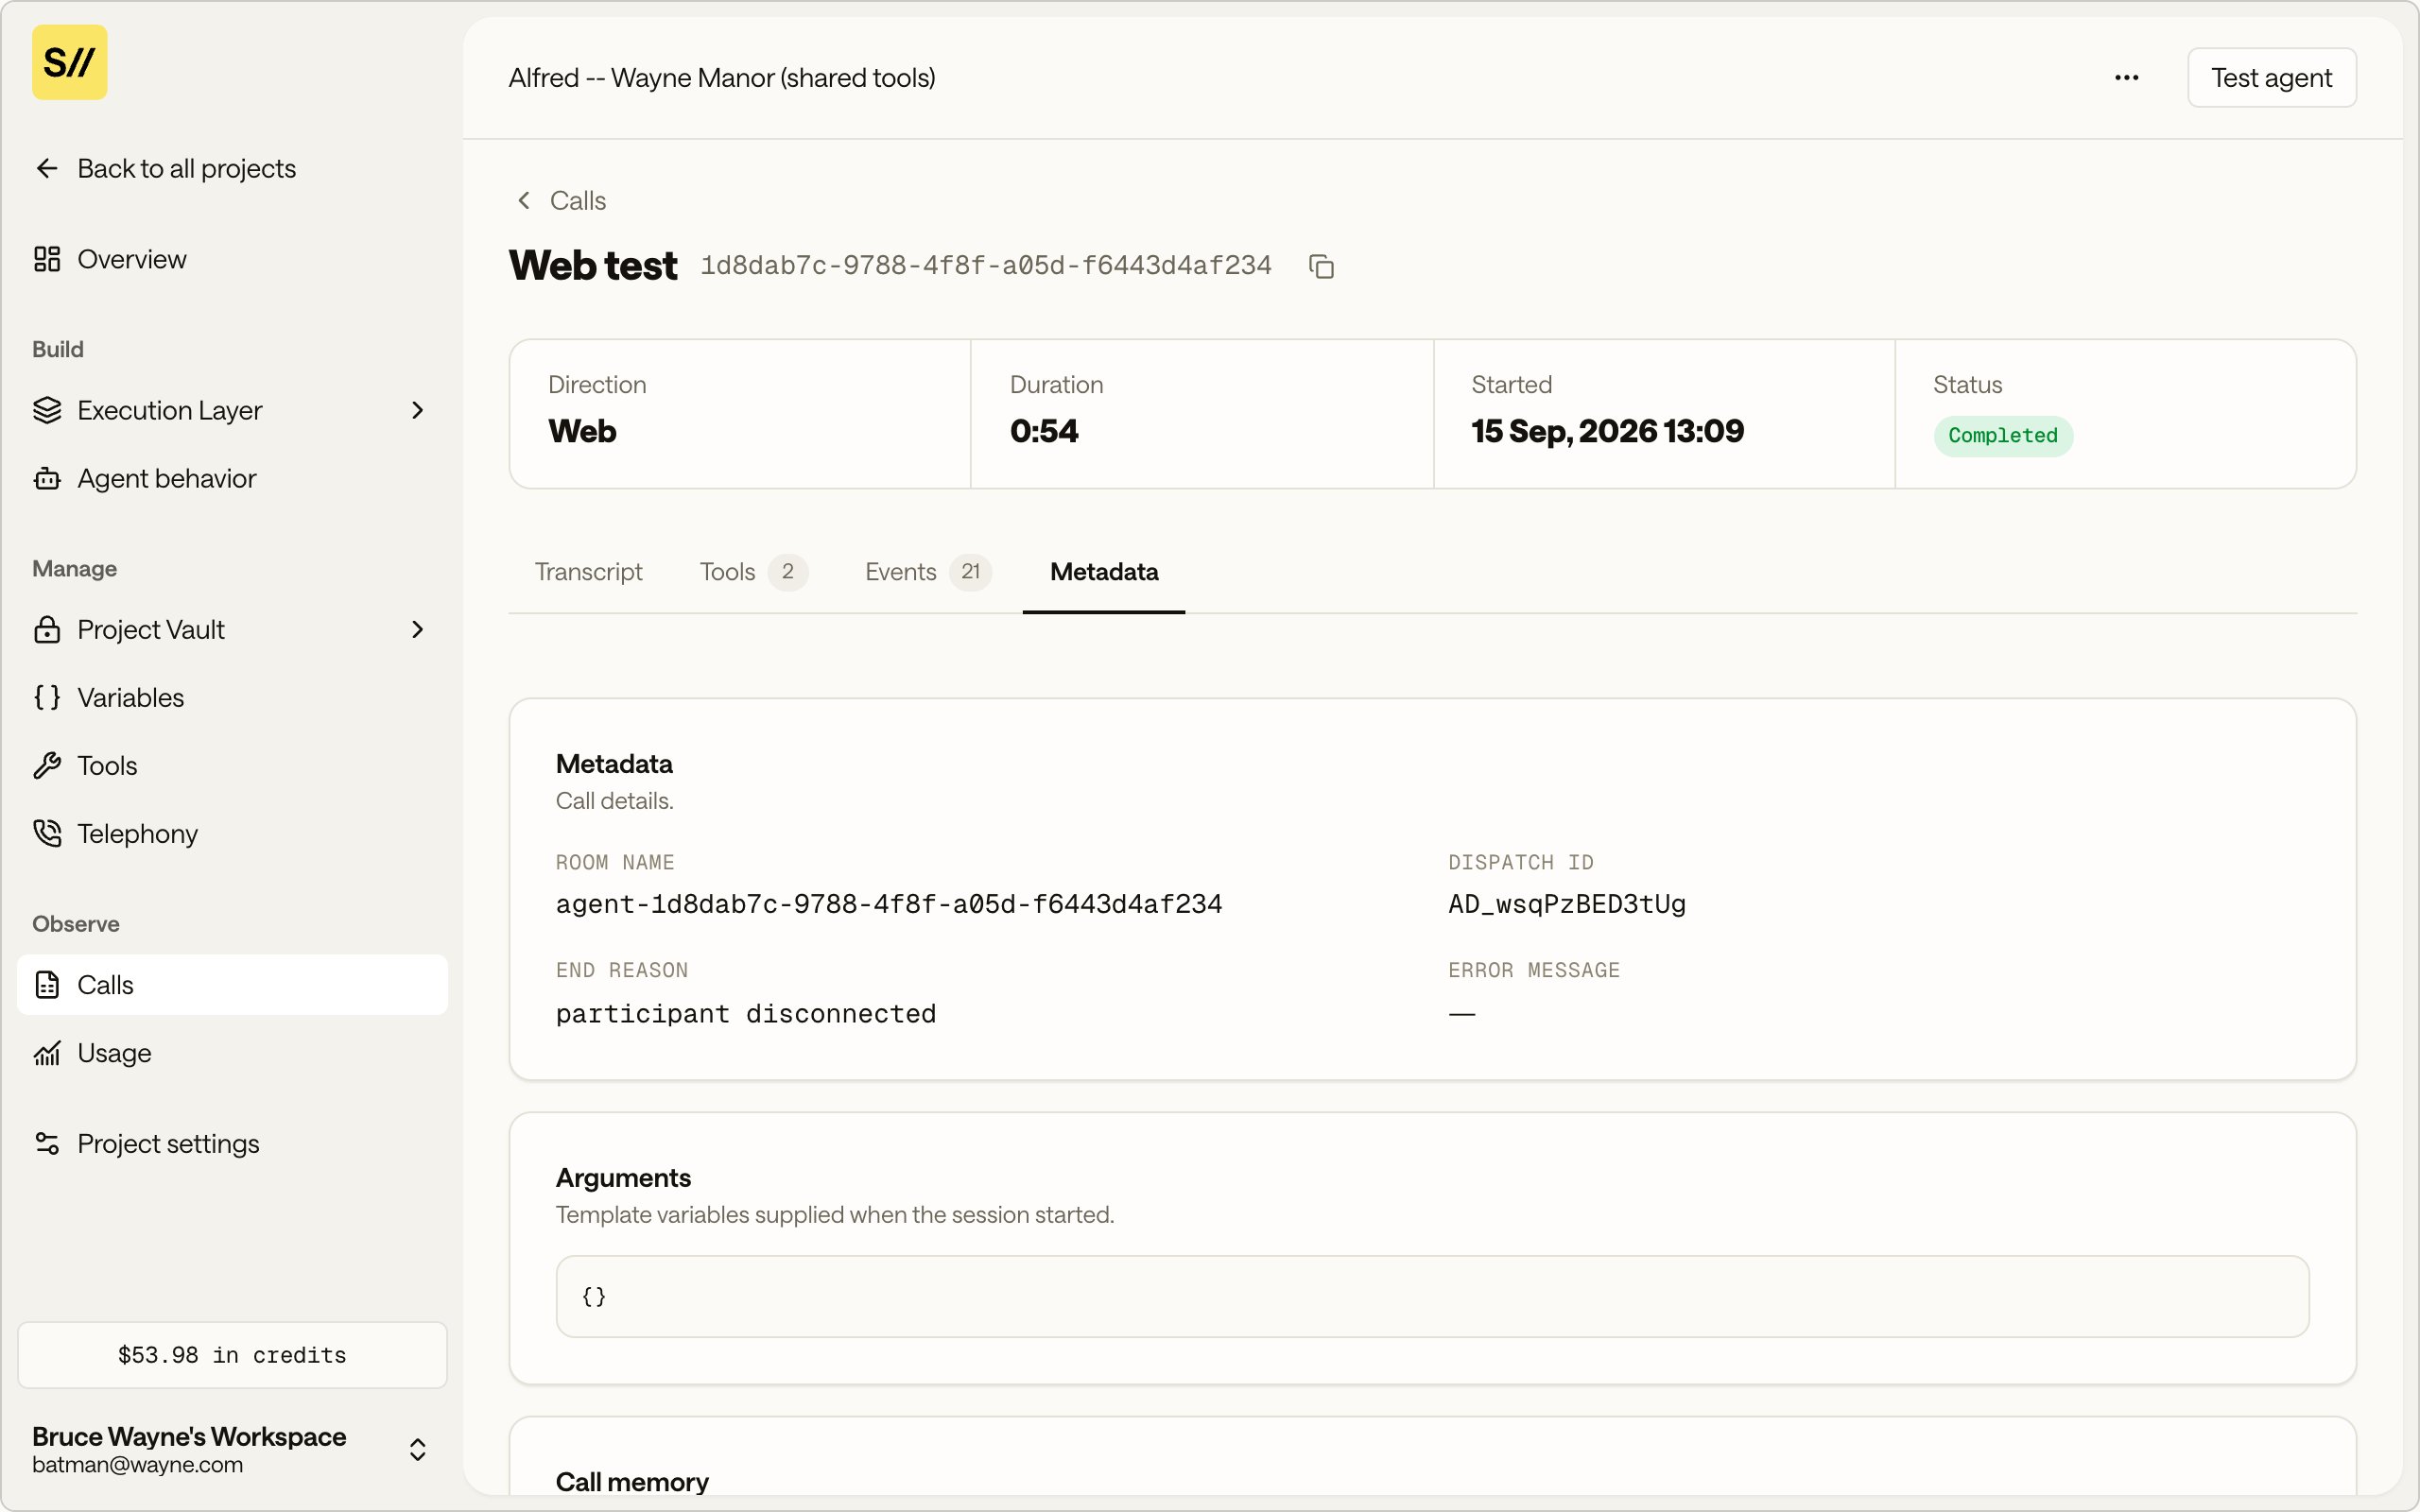
The Metadata tab, with end reason, arguments, call memory, and the rendered prompt.
Find where a call went wrong
Work from the summary down to the raw data:- In the list, check the Status. Open the call that failed.
- On Metadata, read End reason and Error message for the headline cause.
- On Events, find the event with an Error or Reason and expand its JSON.
- On Transcript, read the last exchange before the call dropped.
- On Tools, check the Outcome and HTTP columns. A
failedwebhook with401points at a missing or wrong credential on that tool, even when the call completed. - Check the Rendered prompt to confirm variables resolved as intended.
- For anything unresolved, open Advanced and share the raw report with support.